Australia v India and the ineffectiveness of the full-length delivery
An analysis of why the bat lorded it over ball in the recent ODI series, combining pitching-point data with ball-by-ball information
Kartikeya Date
14-Mar-2016
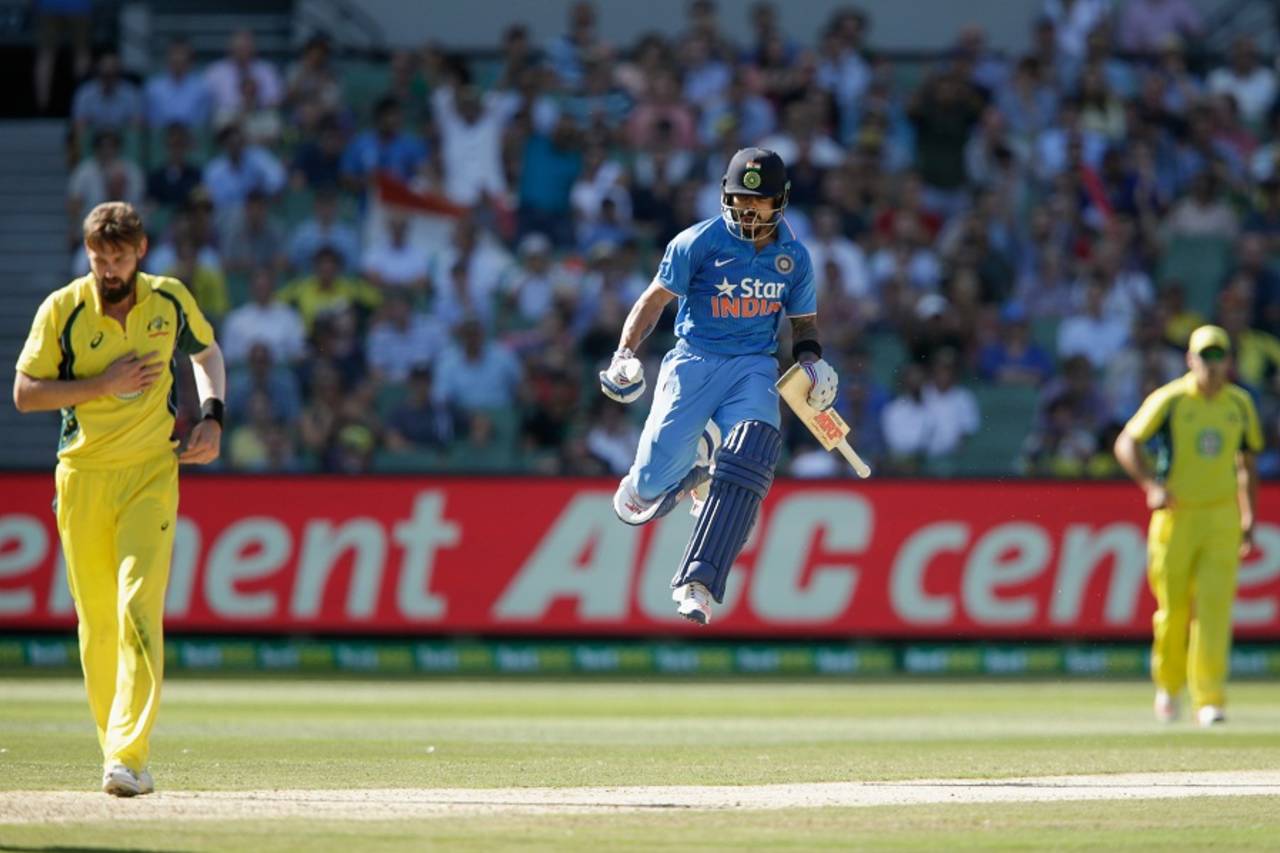
A total of 3159 runs were scored in this five-match ODI series between Australia and India - the most in any bilateral ODI series of five matches or fewer • Getty Images
India and Australia played an extraordinary bilateral ODI series in Australia earlier this year. The bat dominated the ball in a way rarely seen before. India lost 4-1 but were bowled out only once, for 323 in the fourth game, chasing 348.
Bilateral series of five matches or more in which the overall scoring rate is above six runs per over are not uncommon. Of the 29 teams that have managed to score at better than six runs per over in a bilateral series of at least five matches, only six have ended up on the losing side. And only India have lost by a margin of three wins.
Seven of 11 such series so far have involved India. Given India's below-average fast bowling options and above-average batting, this is not surprising. Of those 11, the recent Australia v India series had the highest batting average (50.51 runs per wicket). The bowlers were never in the game.
Usually, even if a side produces a huge score once or twice in a series, there's at least one set of conditions in which the batting collectively fails. New Zealand averaged 333 runs per 300 balls and conceded 8.3 wickets per 300 balls in England in 2015 and lost the series 2-3. In 2009, they faced India in New Zealand and averaged 320 runs per 300 balls, conceded 9.1 wickets per 300 balls, and lost 1-3. In both those cases, they demonstrated a propensity for collapsing. Their style of play produced fast runs, but it also meant that they lost wickets rapidly at other times. India in Australia in 2016 was unique, in that Australia never really challenged India's batting, they just outgunned them. It was not a series between the Indian XI and the Australian XI, it was a series between the Indian batsmen and the Australian batsmen. Four of the five games were won by the chasing side. The fifth was won by the side batting first by 25 runs after the chasing team made the 12th-best score in the history of unsuccessful ODI chases so far.
Yet, as Sanjay Manjrekar observed, the cricket world did not blink an eye. What stood out for him was that "the ball went straight through the air, straight off the pitch onto the bat, and from there, as you would expect, straight to the boundary. The batsmen were standing a foot outside the crease, putting their front foot down the pitch and hitting the big, strapping fast bowlers out of the ground."
The two standard answers in such circumstances - the yorker and the bouncer - are both extremely difficult to bowl perfectly. What's more, the cost of getting a yorker or a bouncer wrong is drastic. A yorker gone wrong can be a full toss or a half-volley, and can mean risk-free runs for the batsman. A bouncer gone wrong can be either a long hop or a wide.
This is why bowlers rarely use these deliveries. Without extreme pace and any help for the spinner, the pattern of ODI games can be reduced to batsmen biding their time against length bowling until the innings reaches a point where they have wickets in hand, so they can tee off against it.
All this can now be demonstrated with data. Phil Oliver, managing editor and co-founder of the cricket analytics company CricViz, shared data on pitching-point coordinates for each delivery bowled in the 2015-16 Australia-India ODI series with me. I combined this data with ball-by-ball outcomes from ESPNcricinfo's commentary to build a record for each delivery that shows the pitching point and the outcome.
In the series as a whole, fewer than five wickets fell on average until the 48th over of the batting innings. A scoring rate of six runs per over could be maintained without too much risk. It was only in the last ten overs, when the average scoring rate crossed seven and approached eight, that teams began to lose wickets. Conceding a run a ball was basically a given during this series. The tempo of the innings, as a rule, was classical: steady at the beginning, explosive in the traditional slog overs.
| Overs | Runs | Wickets |
| 1-5 | 26.0 | 0.5 |
| 6-10 | 28.2 | 0.3 |
| 11-15 | 26.8 | 0.2 |
| 16-20 | 28.8 | 0.2 |
| 21-25 | 32.3 | 0.4 |
| 26-30 | 30.5 | |
| 31-35 | 29.8 | 0.1 |
| 36-40 | 33.1 | 0.7 |
| 41-45 | 35.7 | 1.0 |
| 46-50 | 39.9 | 2.5 |
In the chart below, the line at the 1.2m mark represents the batting crease. If we define yorkers in a strict sense as deliveries that pitch up to five feet from the stumps, less than 1% of the total deliveries in the series were yorkers. Overall, the bowlers preferred the safer good length, and even short of a good length, if the entirety of the innings is considered. The classical yorker length proved to be expensive, and ineffective as far as wickets were concerned. The bouncer proved to be far more effective than the yorker when it came to taking wickets, but it should be noted that bouncers were almost as infrequent as yorkers.
Top: Frequency distribution of lengths, overs 1-50;
Above: Scoring rate and wicket rate for different lengths, overs 1-50
Top left: Frequency distribution of lengths, overs 40-50, first innings; Bottom left: Scoring rate and wicket rate for different lengths, overs 40-50, first innings
Top right: Frequency distribution of lengths, overs 40-50, second innings; Bottom right: Scoring rate and wicket rate for different lengths, overs 40-50, second innings
Top right: Frequency distribution of lengths, overs 40-50, second innings; Bottom right: Scoring rate and wicket rate for different lengths, overs 40-50, second innings
The chart above (left) shows the same calculation for the last ten overs of the first innings of the match. Even though the distribution of lengths changes - the bowling sides tried more full-length deliveries, the effectiveness (lack thereof) does not. In the last ten overs of the second innings (above, right), the full-length delivery was less popular but just as ineffective. The short-of-a-length delivery and the outright short-pitched delivery caused trouble. Keep in mind that India were defending totals in three out of five matches, so these charts do not represent tactical preferences for any one side.
Top: Frequency distribution of lengths, overs 1-10; Bottom: Scoring rate and wicket rate for different lengths, overs 1-10
While the charts showing the scoring rate and wicket rate by length of delivery in the final ten overs of the innings illustrate the limits of the full-length delivery, it is the chart for the first ten overs of the innings that truly indicts the pitches (above right). The full-length delivery was, not surprisingly, shelved by both sides with the new ball. When bowlers strayed too full, they went for plenty of runs. The ineffectiveness of good-length deliveries is truly notable.
The analysis in this post is necessarily brief and introductory. For instance, I have set aside the line of the delivery. I have also set aside the identities of bowlers and batsmen and specific match-ups at specific times in the game.
But it shows what cricket fans would be able to study and analyse if ball-by-ball records coupled with pitching-point data became available as commonly as a player's career details currently are on Statsguru. Now that cricket has entered an age of vastly greater budgets than ever before in its history, the sophistication of the analysis must also improve. A great deal of analysis becomes simple with pitching points. For instance, given such data over, say, 50 games by a bowler or a batsman, it would be possible to understand the player's preferences, weaknesses and tendencies far more systematically.
All this becomes possible just with pitching-point data. Imagine what would be possible if we also had the coordinates of the point at which the ball crossed the plane of the stumps at the batting end, the coordinates of the release point, the speed of the ball at release, the speed of the ball at the batting end, and the field placing for each delivery. One could design a sophisticated curriculum for teaching applied statistics and even machine learning with all this information, while taking cricket analysis to the cutting edge. Perhaps most excitingly, it would be possible to produce a statistical profile of each pitch and classify pitches based on such a profile.
Behind proprietary doors, franchises and international sides are probably already using data of this quality and have probably even developed some sophisticated measures. These measures will only improve as the amount of data available increases. The public domain of the press box and the match report remains largely oblivious to all these developments. The danger is that this distance will grow significantly large and the game that is being planned in the dressing room and played out on the field, and the game described from the press box may soon have very little resemblance to each other.
Data is powerful, and it is time for the next generation of Statsguru to be developed in cricket. Only then will we fully understand anomalous series like India's recent limited-overs tour of Australia.
Kartikeya Date writes at A Cricketing View and tweets here