We need a better measure than economy rate in T20
The traditional metric has served well, but it doesn't take context into account
Freddie Wilde
28-Feb-2017
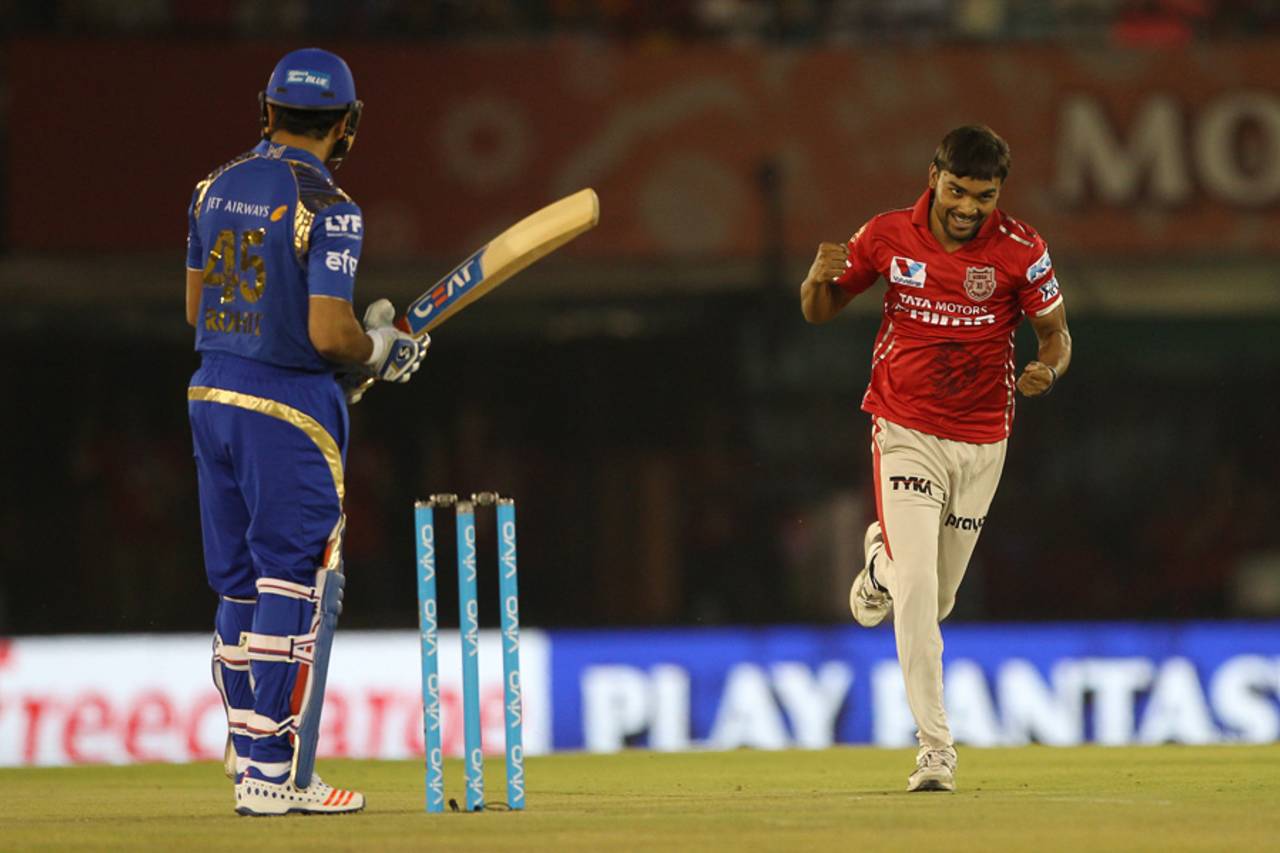
Mr Parsimony: in the last IPL, Sandeep Sharma's overall economy rate was nearly a run and a half per over lower than the run rate in the innings he bowled in • BCCI
In T20 cricket, economy rate is the most widely used metric by which to assess and compare bowlers. However, despite its simple utility, it is a flawed and misleading measure. In only taking into account balls bowled and runs conceded, economy rate disregards the context of the match in which those balls were bowled and runs were conceded. The match venue, conditions, strength of the opposition batting and the nature of the match itself are critical determining factors of economy rate that are not considered by the measure.
The great strength of economy rate is that its normalisation across six-ball overs allows for straightforward comparison between bowlers. However, using a new measure, economy-rate differential (ERx), it is possible to maintain comparison while placing economy rate within the context of the innings.
ERx is calculated by subtracting the innings run rate from the bowler's economy rate to give a more accurate representation of that bowler's performance in that innings. For example, in the final of the 2016 IPL between Royal Challengers Bangalore and Sunrisers Hyderabad, Yuzvendra Chahal returned figures of 1 for 35 from his four overs, at a typically mid-to-high range economy rate of 8.75. However, placed within the context of the innings, Chahal's economy rate was 1.65 runs per over fewer than the innings run rate of 10.40; in other words, a fairly good showing.
Although such a conclusion could be reached from an analytical observation of the scorecard, the presentation of traditional economy rate over a season or competition would fail to illustrate this nuance the way ERx can: a bowler with a negative ERx is a bowler who performs above average in the innings in which they bowl; a bowler with a positive ERx is a bowler who performs below average in the innings in which they bowl.
It is possible to apply ERx to a career by subtracting the overall run rate of all the bowling innings a player is involved in from their overall career economy rate; similarly, it can be applied to a competition by doing the same with the competition economy rate. I have analysed the bowlers in the 2016 IPL using this method.
| Bowler | Overs | ER (rank) | Innings RR | ERx |
| Adam Zampa (RPS) | 17.0 | 6.76 (1) | 7.89 | -1.42 |
| Sandeep Sharma (KXIP) | 50.0 | 7.32 (7) | 8.56 | -1.24 |
| Sunil Narine (KKR) | 42.4 | 7.12 (4) | 8.25 | -1.13 |
| Sreenath Aravind (RCB) | 29.1 | 7.40 (9) | 8.51 | -1.11 |
| Chris Morris (DD) | 44.0 | 7.00 (3) | 8.10 | -1.10 |
| Dhawal Kulkarni (GL) | 49.0 | 7.42 (10) | 8.52 | -1.10 |
| Mustafizur Rahman (SRH) | 61.0 | 6.90 (2) | 7.95 | -1.05 |
| Rajat Bhatia (RPS) | 34.0 | 7.17 (5) | 8.12 | -0.95 |
| Ravichandran Ashwin (RPS) | 44.0 | 7.25 (6) | 8.10 | -0.85 |
| Ravindra Jadeja (GL) | 40.1 | 7.74 (20) | 8.56 | -0.82 |
| Praveen Kumar (GL) | 51.3 | 7.78 (21) | 8.46 | -0.68 |
| Amit Mishra (DD) | 46.0 | 7.47 (12) | 8.13 | -0.66 |
| Ashok Dinda (RPS) | 30.3 | 7.57 (14) | 8.15 | -0.58 |
| Tim Southee (MI) | 43.0 | 7.65 (16) | 8.23 | -0.58 |
| Yuzvendra Chahal (RCB) | 49.1 | 8.15 (29) | 8.72 | -0.57 |
Bowlers who traditionally have good economy rates will generally continue to be rewarded under ERx (unless they play in a really strong bowling team) so it is unsurprising to see the list of top ERx bowlers dominated by those with top economy rates. However the presence of Ravindra Jadeja, Praveen Kumar and Chahal in the list illustrates the value of ERx in that these are four bowlers outside the top 20 economy rates who make an appearance on this list of top 15 ERx bowlers because their economy rate was better than the average run rate of innings in which they bowled.
| Bowler | Overs | ER (rank) | Innings RR | ERx |
| Kyle Abbott (KXIP) | 16.0 | 11.06 (59) | 9.14 | +1.92 |
| Ishant Sharma (RPS) | 15.0 | 9.86 (57) | 7.96 | +1.90 |
| Thisara Perera (RPS) | 33.1 | 9.82 (56) | 8.09 | +1.73 |
| James Faulkner (GL) | 17.0 | 9.82 (56) | 8.22 | +1.49 |
| Karn Sharma (SRH) | 16.2 | 10.46 (58) | 8.99 | +1.47 |
| Mohammad Shami (DD) | 25.1 | 9.69 (54) | 8.32 | +1.37 |
| Shadab Jakati (GL) | 20.0 | 8.90 (46) | 7.95 | +0.95 |
| Umesh Yadav (KKR) | 26.0 | 9.00 (48) | 8.11 | +0.89 |
| Chris Jordan (RCB) | 28.0 | 9.21 (51) | 8.33 | +0.88 |
| Varun Aaron (RCB) | 23.4 | 9.59 (53) | 8.73 | +0.86 |
| KC Cariappa (KXIP) | 17.0 | 9.35 (52) | 8.56 | +0.79 |
| Barinder Sran (SRH) | 49.3 | 8.34 (34) | 7.62 | +0.72 |
| Hardik Pandya (MI) | 16.4 | 9.18 (50) | 8.54 | +0.64 |
| Brad Hogg (KKR) | 16.0 | 8.87 (45) | 8.36 | +0.51 |
| Dwayne Bravo (GL) | 56.0 | 8.82 (44) | 8.45 | +0.37 |
Similarly, there is a strong correlation between the worst ERx bowlers and the ones with the worst economy rates, but ERx gives greater context to the economy rates. For example, Ishant Sharma's economy rate of 9.86 is made to look considerably worse by the fact that the innings run rate in matches in which he bowled was almost two runs per over lower.
By comparing a bowler's ranking under economy rate with their ranking under ERx it is possible to ascertain those whose rankings change most significantly as a result of the new measure. In the case of positive movers - those whose ERx ranking is higher than their economy rate ranking - the size of their move illustrates how significantly economy rate undervalues their performance.
| Bowler | Overs | ER | ERx | Move |
| Tabraiz Shamsi (RCB) | 16.0 | 9.18 (49) | -0.19 (32) | +17 |
| Shivil Kaushik (GL) | 23.0 | 8.34 (32) | -0.54 (16) | +16 |
| Shabhaz Nadeem (DD) | 15.0 | 8.46 (39) | -0.39 (24) | +15 |
| Iqbal Abdulla (RCB) | 25.0 | 8.52 (41) | -0.27 (26) | +15 |
| Yuzvendra Chahal (RCB) | 49.1 | 8.15 (29) | -0.57 (15) | +14 |
| Shane Watson (RCB) | 56.3 | 8.58 (42) | -0.24 (28) | +14 |
| Imran Tahir (DD) | 16.0 | 8.62 (43) | -0.20 (31) | +12 |
| Ravindra Jadeja (GL) | 40.1 | 7.74 (20) | -0.82 (10) | +10 |
| Praveen Kumar (GL) | 51.3 | 7.78 (21) | -0.68 (11) | +10 |
| Axar Patel (KXIP) | 47.5 | 8.11 (28) | -0.45 (20) | +8 |
It is unsurprising to see Royal Challengers Bangalore bowlers feature prominently on the above list because RCB's home ground, the M Chinnaswamy Stadium, was the best venue for batting last season, which meant RCB bowlers therefore had relatively high economy rates. However, when the economy rates of Tabraiz Shamsi, Iqbal Abdulla, Chahal and Shane Watson are compared with the innings run rates of the innings they bowled in, it shows the four of them to have bowled considerably better than the innings average.
| Bowler | Overs | ER | ERx | Move |
| Jayant Yadav (DD) | 17.0 | 7.35 (8) | -0.05 (37) | -29 |
| Nathan Coulter-Nile (DD) | 15.0 | 7.60 (15) | 0.25 (42) | -27 |
| Barinder Sran (SRH) | 49.3 | 8.34 (34) | 0.72 (48) | -14 |
| Moises Henriques (SRH) | 52.0 | 7.98 (26) | 0.02 (39) | -13 |
| Shakib Al Hasan (KKR) | 31.0 | 7.83 (23) | -0.16 (35) | -12 |
| Carlos Brathwaite (DD) | 23.1 | 8.15 (30) | 0.02 (38) | -8 |
| Morne Morkel (KKR) | 35.3 | 8.36 (35) | 0.26 (43) | -8 |
| Marcus Stoinis (KXIP) | 23.0 | 8.43 (37) | 0.36 (44) | -7 |
| Bhuvneshwar Kumar (SRH) | 66.0 | 7.42 (11) | -0.54 (17) | -6 |
| Krunal Pandya (MI) | 31.1 | 7.57 (13) | -0.52 (19) | -6 |
The biggest negative movers are bowlers whose performances have been flattered by their economy rates. For example, Nathan Coulter-Nile's economy rate of 7.60 is, at first glance, a good one; however, ERx shows that figure to have been 0.25 runs per over worse than the innings average--not so impressive.
It is long overdue in T20 coverage for career and competition economy rates to be presented by match phase, which are typically considered to be: Powerplay (over one to six), middle overs (seven to 15) and death overs (16 to 20). ERx by phase would be a further improvement on this.
The value of doing this is illustrated by Dwayne Bravo in the 2016 IPL, whose economy rate of 8.82 is typically high. However, analysing Bravo's bowling by phase shows him to have bowled 49% of his deliveries in the death overs - the most expensive phase of the innings - which will have significantly affected his overall economy rate. Closer analysis of his phase breakdown shows him to have recorded negative ERx (better than the innings average economy rate for the phase) in the middle overs (economy rate 6.29, ERx -1.45) and the death overs (economy rate: 10.52, ERx -0.68). He only bowled two overs in the Powerplay phase. Calculating ERx in this manner adds another layer of depth to the measure and helps provide an even more accurate reflection of a bowler's performance.
Economy rate is a measure that has served cricket well for decades. However, in T20, where the margins are so fine, it is a measure that lacks the nuance to give an accurate enough reflection of a bowler. ERx provides for a more complete picture by factoring in the opposition batting strength, conditions and the match scenario, to offer a fairer representation of a bowler that remains simple to understand.
Freddie Wilde is a freelance T20 journalist. @fwildecricket