Can Bangladesh replicate ODI success in Tests?
Since the 2015 World Cup, Bangladesh have clearly lifted their ODI game against the top teams; now they need to do the same in Tests
S Rajesh
21-Oct-2016
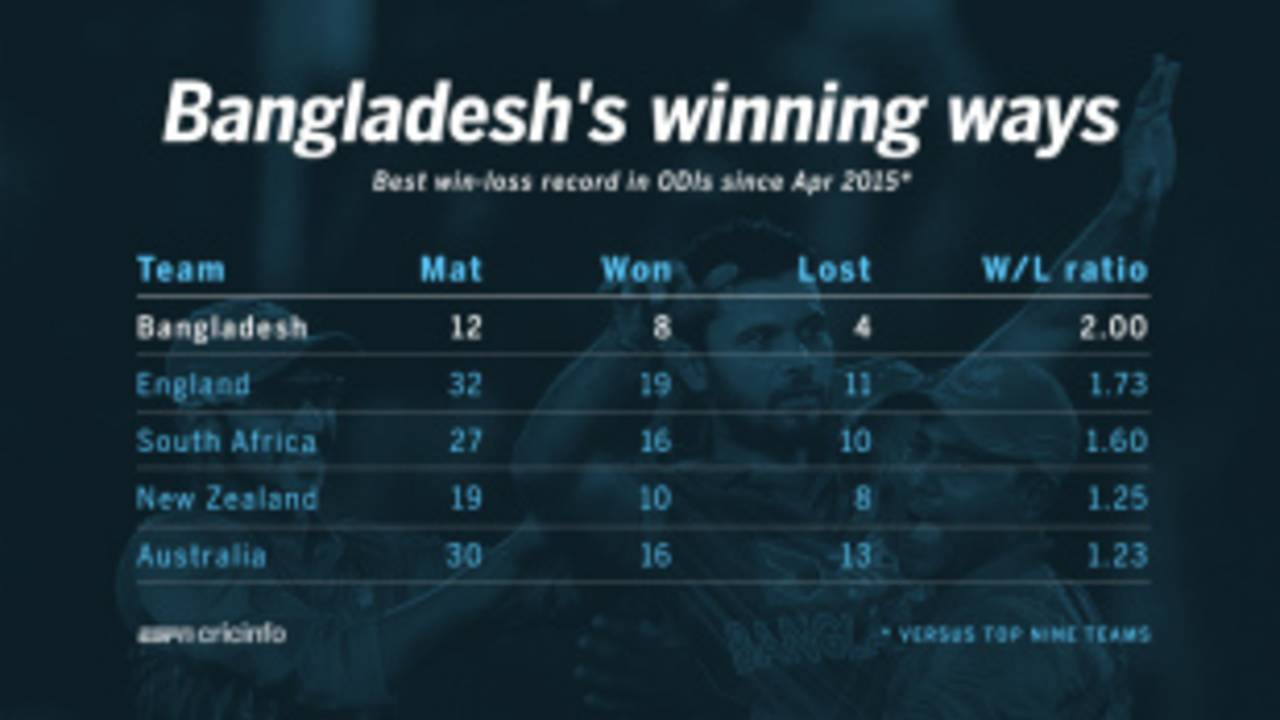
Bangladesh have a better win-loss ratio than any other team in ODIs since the 2015 World Cup • ESPNcricinfo Ltd
Since the 2015 World Cup, Bangladesh's ODI team has been on a roll. Though they lost the three-match series 2-1 to England, neither of their defeats were one-sided: they were in a position of dominance in the first game, requiring 45 from the last nine overs with six wickets in hand, and posted a challenging 277 in the third, before falling short in both matches. The defeats brought to an end Bangladesh's glorious run in bilateral ODI series at home - they won six in a row, including victories against Pakistan, India and South Africa, and in the process equalled the record for most bilateral home series wins in a row: India had six between December 2009 and November 2011.
In the last 18 months especially, Bangladesh's ODI stats have stood out because they have notched up wins against some of the top ODI teams, and have been extremely competitive even in defeat. Their overall win-loss ratio of two wins per defeat against the top nine ODI teams during this period is better than that of any other side. England and South Africa are the only other teams with ratios of more than 1.50, while the other three big Asian teams - India, Pakistan and Sri Lanka - all have ratios of less than 0.6.
What has stood out for Bangladesh through this run has been their batting - they have averaged more than 39 runs per wicket and 5.72 runs per over; in the couple of years before that they averaged 29.31 runs per wicket, and 5.18 per over. With the ball, they averaged 31.52 runs per wicket at an economy rate of 5.24, which suggests the improvement in batting has been far more dramatic than the incremental improvement in bowling.
| Team | Bat ave | Run rate | Bowl ave | Econ rate |
| Bangladesh | 39.27 | 5.72 | 28.54 | 5.08 |
| England | 40.27 | 6.25 | 35.64 | 5.73 |
| South Africa | 37.81 | 5.70 | 31.53 | 5.61 |
| New Zealand | 36.40 | 6.01 | 31.69 | 5.93 |
| Australia | 35.09 | 5.69 | 33.02 | 5.66 |
| Pakistan | 33.79 | 5.53 | 40.90 | 5.77 |
| India | 37.87 | 5.80 | 40.70 | 6.02 |
| Sri Lanka | 29.71 | 5.33 | 39.71 | 5.99 |
| West Indies | 24.21 | 5.09 | 37.48 | 5.62 |
In the last 18 months, four Bangladesh batsmen have scored 250-plus runs at averages of more than 40 against the top teams, with three of them averaging more than 50. Tamim Iqbal, who had averaged less than 28 against the top teams till the 2015 World Cup, has averaged 53.20 since then, while Soumya Sarkar, Mushfiqur Rahim and Shakib-Al-Hasan have all been far more prolific since the 2015 World Cup than they were earlier in their careers.
The difference in bowling numbers isn't as stark, but the big difference has been the emergence of Mustafizur Rahman. He has been outstanding against the top teams too, taking 18 wickets in just six games at 12.61, while Mashrafe Mortaza has found form too despite his injuries.
| Player | From Apr '15 - Wkts | Average | Econ rate | Before Apr '15 - wkts | Average | Econ rate |
| Mashrafe Mortaza | 18 | 26.33 | 5.28 | 95 | 40.75 | 5.16 |
| Mustafizur Rahman | 18 | 12.61 | 4.25 | _ | _ | _ |
| Shakib Al Hasan | 14 | 33.78 | 4.57 | 100 | 33.43 | 4.60 |
| Nasir Hossain | 10 | 33.10 | 4.26 | 5 | 56.00 | 4.94 |
| Rubel Hossain | 10 | 31.50 | 5.43 | 54 | 34.70 | 6.03 |
While all of those numbers have gladdened the hearts of Bangladesh's supporters, the team needs to prove they can come up with similarly impressive numbers in Tests as well. They have won seven out of 93 so far, but five of those have come against Zimbabwe, and two against a second-string West Indies. On the other hand they have lost 71, including all 12 Tests against Australia and England, and nine of ten against Pakistan.
Most teams have struggled in their early years in Test cricket, but for Bangladesh so far, the results have been poorer than for all other teams. Their win-loss ratio of 0.1 is the worst among all teams after 93 Tests, while the 71 Tests they have lost is 15 more than the next highest - Zimbabwe, with 56 - at the same stage of their Test journey. New Zealand had won fewer Tests, but they had managed 42 draws to Bangladesh's 16.
| Team | Won | Lost | Drawn | W/L ratio |
| England | 43 | 33 | 17 | 1.30 |
| Australia | 39 | 36 | 18 | 1.08 |
| West Indies | 30 | 32 | 30 | 0.93 |
| Pakistan | 15 | 26 | 52 | 0.57 |
| Sri Lanka | 15 | 38 | 40 | 0.39 |
| South Africa | 15 | 49 | 29 | 0.30 |
| India | 9 | 35 | 49 | 0.25 |
| Zimbabwe | 11 | 56 | 26 | 0.19 |
| New Zealand | 6 | 45 | 42 | 0.13 |
| Bangladesh | 7 | 71 | 16 | 0.10 |
In their 93 Tests, Bangladesh have averaged 24.22 with the bat, and 49.25 with the ball. The difference of 25.03 is easily the worst among all teams; no other side has a negative difference of more than 14. Bangladesh are the only team with a bowling average that is more than twice the batting one - clear evidence of how much they have struggled with Test cricket so far.
| Team | Bat ave | Bowl ave | Difference |
| England | 24.63 | 21.52 | 3.11 |
| West Indies | 33.40 | 31.91 | 1.49 |
| Australia | 24.31 | 24.97 | -0.66 |
| Pakistan | 29.73 | 34.40 | -4.67 |
| Sri Lanka | 29.14 | 36.98 | -7.84 |
| India | 28.70 | 37.18 | -8.48 |
| South Africa | 24.70 | 33.34 | -8.64 |
| Zimbabwe | 26.37 | 38.37 | -12.00 |
| New Zealand | 23.28 | 36.43 | -13.15 |
| Bangladesh | 24.22 | 49.25 | -25.03 |
Over the next three months, Bangladesh have five Tests coming up - two at home against England, and then two in New Zealand and one in India. By the end of the Test against India, Bangladesh would be just two away from 100 Tests. When they get there, they would want their Test graph to be going in the direction that their ODI fortunes have been going recently.
S Rajesh is stats editor of ESPNcricinfo. Follow him on Twitter.