Centuries galore for South Africa
Other teams have matched South Africa's top order in terms of averages and run rates in ODIs in the last two years, but none has scored hundreds at the rate that South African batsmen have
S Rajesh
30-Jan-2015
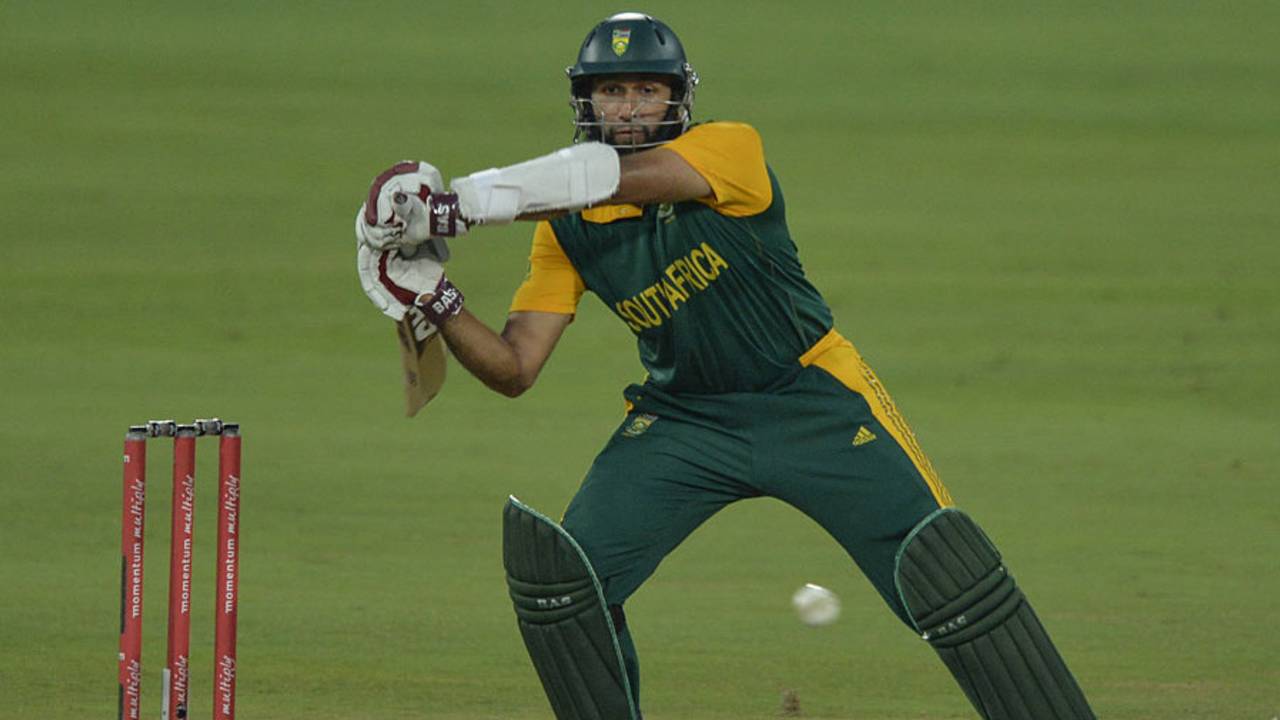
Hashim Amla has scored nine hundreds in 44 ODI innings since the start of 2013, an average of a century every 4.89 innings • Associated Press
In the recently concluded five-ODI series against West Indies, South Africa's batsmen slammed six hundreds: two each by Hashim Amla and Rilee Rossouw, and one by AB de Villiers and David Miller. Each of those innings exceeded 125, and only one ended with a sub-100 strike rate: Miller's 130 in Port Elizabeth came in 133 balls, and was the slowest of those six innings.
It's rare that a team scores so many hundreds in an ODI series. Sri Lanka's seven in the 2011 World Cup is the highest in any series or tournament, but in a bilateral series, six centuries have been achieved on only four other occasions: by South Africa, against Zimbabwe in 2010, by India against Australia in 2013-14, by Sri Lanka against England in 2006, and by Pakistan against India in 1982-83. In none of these four instances, though, were each of the hundreds in excess of 125, which makes South Africa's recent effort the first instance of six scores of 125 or more by a team in an ODI series, bilateral or otherwise.
In recent times, there's been a solidity and flair to South Africa's batting that makes them arguably the most feared batting line-up going into the 2015 World Cup. Amla and de Villiers have been stunningly consistent and yet explosive, while the others in the top order have batted well around them. Quinton de Kock has shone in the short period that he has played one-day internationals, Miller has handled the pressures of batting at No. 6 pretty well, while Faf du Plessis and JP Duminy have shown they are adept at this format too. In the last two years, all six of these players have averaged more than 35 in ODIs, at a strike rate of more than 80. Rossouw has been the exception, largely because he also has five ducks to go with his two hundreds in 14 ODI innings.
In the last couple of years, the ability of South Africa's top order to score hundreds has set them apart from other sides. Since the beginning of 2013, South Africa's top seven batsmen have scored 30 centuries in 53 matches. Their top seven have batted 349 times to score those 30 centuries, which means they've averaged a hundred every 11.63 innings. Other top orders have matched South Africa's average and scoring rate, but not their frenetic rate of scoring centuries. Australia, with 20 hundreds in 299 innings, are second with a rate of 14.95 innings per hundred; South Africa's rate is about 22% better. India's top order has a better batting average, but they've only scored a hundred once every 16 innings. Sri Lanka and West Indies have averaged around 20 innings, while the average for England and Pakistan is around 25 innings, more than twice South Africa's rate.
| Team | Matches | Inngs | Average | Strike rate | 100s/ 50s | Inngs/100 |
| South Africa | 53 | 349 | 38.60 | 88.70 | 30/ 54 | 11.63 |
| Australia | 46 | 299 | 37.06 | 88.55 | 20/ 51 | 14.95 |
| India | 61 | 370 | 40.98 | 87.69 | 23/ 73 | 16.09 |
| New Zealand | 42 | 269 | 35.04 | 88.42 | 16/ 37 | 16.81 |
| Sri Lanka | 69 | 437 | 34.18 | 81.69 | 22/ 75 | 19.86 |
| West Indies | 42 | 289 | 29.75 | 81.24 | 14/ 40 | 20.64 |
| England | 49 | 323 | 33.61 | 84.37 | 13/ 53 | 24.85 |
| Pakistan | 50 | 343 | 31.80 | 78.12 | 13/ 58 | 26.38 |
| Bangladesh | 27 | 173 | 30.40 | 78.91 | 5/ 28 | 34.60 |
| Zimbabwe | 30 | 201 | 26.72 | 72.03 | 2/ 30 | 100.50 |
Among batsmen who've scored at least four ODI hundreds in the last two years, Amla's rate of getting them is well clear of everyone else. He has scored a century every 4.89 innings, thanks to an excellent conversion rate of nine hundreds out of 17 fifty-plus scores in 44 innings. Next in the list is also a South African, with de Kock getting six in 36 innings. Both Amla and de Kock have the advantage of opening the batting and thus the best opportunity to bat long, but Ross Taylor scored five in 32 innings despite batting at No. 4, just as de Villiers got six hundreds in 45 innings despite mostly batting at No. 5 or 6.
| Batsman | Inngs | Runs | Average | Str rate | 100s/ 50s | Inngs/100 |
| Hashim Amla | 44 | 2143 | 52.26 | 86.62 | 9/ 8 | 4.89 |
| Quinton de Kock | 36 | 1486 | 42.45 | 88.29 | 6/ 4 | 6.00 |
| Ross Taylor | 32 | 1344 | 49.77 | 81.35 | 5/ 7 | 6.40 |
| Virat Kohli | 53 | 2338 | 53.13 | 97.78 | 8/ 12 | 6.63 |
| AB de Villiers | 45 | 2291 | 60.28 | 107.60 | 6/ 14 | 7.50 |
| Aaron Finch | 38 | 1447 | 38.07 | 86.38 | 5/ 6 | 7.60 |
| Shikhar Dhawan | 46 | 1988 | 46.23 | 92.42 | 6/ 10 | 7.67 |
| Kumar Sangakkara | 57 | 2778 | 54.47 | 89.61 | 7/ 20 | 8.14 |
Amla and de Villiers have also been among the top performers in the middle overs, which is why they end up scoring so many hundreds. Both Amla and de Villiers average more than 70 in the middle overs, and strike at around 90. Their combination has ensured that South Africa mostly enter the last phase of their innings with plenty of wickets in hand, thus giving themselves the best opportunity to utilise the slog overs.
South Africa is the only team with two batsmen averaging more than 70 and striking at around 90. India have Virat Kohli, whose stats are similar to those of Amla and de Villiers - the other Indian batsman who has done well in the middle overs is Rohit Sharma, who averages more than 62. Kane Williamson has been the star for New Zealand, while Kumar Sangakkara has been outstanding for Sri Lanka, but most of these teams don't have quite the depth of South Africa. Whether that advantage translates into wins for them in crucial World Cup games is, of course, another matter altogether.
| Batsman | Runs | Dismissals | Average | Strike rate |
| Hashim Amla | 1175 | 16 | 73.43 | 89.00 |
| Virat Kohli | 1727 | 24 | 71.95 | 96.67 |
| AB de Villiers | 1719 | 24 | 71.62 | 98.33 |
| Kane Williamson | 1108 | 16 | 69.25 | 91.50 |
| Kumar Sangakara | 2042 | 30 | 68.06 | 90.00 |
| Rohit Sharma | 1059 | 17 | 62.29 | 94.83 |
| Ross Taylor | 936 | 16 | 58.50 | 73.67 |
| Misbah-ul-Haq | 1328 | 24 | 55.33 | 68.17 |
| George Bailey | 1101 | 20 | 55.05 | 81.17 |
| Shikhar Dhawan | 1104 | 22 | 50.18 | 99.67 |
S Rajesh is stats editor of ESPNcricinfo. Follow him on Twitter